
Welcome, fellow trader! 🙌
If you’re reading this, then you’re probably looking to take your trading game to the next level. Maybe you’re tired of feeling like you’re gambling with your hard-earned cash, or maybe you’re just getting started and need some clarity on how to navigate the vast ocean of financial markets. Either way, you’re in the right place! Today, we’re going to dive into one of the most powerful aspects of trading that can make all the difference: trading indicators.
Think of trading indicators as your trusty compass, map, and GPS all rolled into one. Without them, trading is like trying to find your way through a dense forest without a trail. 🚶♀️🌲 You may get lucky once or twice, but chances are, you’ll end up lost (and a little frustrated). Luckily, with a bit of know-how, trading indicators can help you make smarter, more informed decisions, turning your trading journey into a much smoother ride. 🚗💨
Let’s break it down, shall we? 😁
What Are Trading Indicators, Anyway? 🤔
Let’s break it down. Trading indicators are mathematical calculations applied to price, volume, or other market data. In simpler terms, they’re tools that help you make sense of the market chaos. 📊
Think of them as your trading GPS. Just like a GPS tells you when to turn left or right, indicators guide you on when to buy, sell, or stay the heck away. They’re categorized into two main types:
- Lagging Indicators: These confirm trends after they’ve started. (Great for catching the wave 🌊.)
- Leading Indicators: These predict future movements. (Perfect for the fortune-teller in you 🔮.)
Now that we know what they are, let’s dig into why indicators are so essential for trading.
Why Do You Need Indicators in the First Place? 🧐
You might be wondering, “Why can’t I just trust my gut?” Well, while gut feelings can be great for picking dinner spots 🍕, they’re not the best for trading. Here’s why indicators are essential for success in trading:
1. Trends, Trends, Trends! 📈
You’ve probably heard the phrase “the trend is your friend.” Well, it’s true! The biggest mistake traders make is going against the trend, and that’s where indicators come in. Indicators like Moving Averages (MAs) or MACD are like a compass, helping you follow the market’s lead rather than wandering off track. They show you if the market is trending up, down, or sideways—so you know whether to join the party or stay home. 🎉🚪
2. Timing Is Everything ⏰
You’ve probably heard someone say, “I bought at the top and sold at the bottom.” Well, don’t be that person! Indicators like the Relative Strength Index (RSI) or Stochastic Oscillator help you figure out when prices are too high (overbought) or too low (oversold). This gives you a clear signal to enter or exit a trade with precision. Think of it like setting your alarm clock—timing is key! ⏰
3. Risk Management—Because Who Wants to Lose Money? 💸
Risk management is the name of the game. You can’t control how the market behaves, but you can control your risk. Indicators like Average True Range (ATR) help you measure volatility so you can set stop-loss orders appropriately. This helps you protect your capital and sleep easy at night knowing you’re not exposed to excessive risk. 😴
4. No Emotions Allowed! 🚫
Trading with emotions is like trying to ride a roller coaster with your eyes closed. It’s unpredictable, and you’re likely to crash (metaphorically speaking!). That’s where indicators come in. By relying on solid data, you remove emotions like fear, greed, and FOMO (fear of missing out) from your decisions. It’s all about objectivity. Data doesn’t care if you’re having a bad day or feeling super lucky—indicators just give you the facts. 📊
Let’s Meet the Star Players: Popular Trading Indicators 🌟
Now that you know why indicators are so important, let’s get to the good stuff. Here are some of the most popular indicators traders use and how they can help you make those sweet, sweet profits. 💵
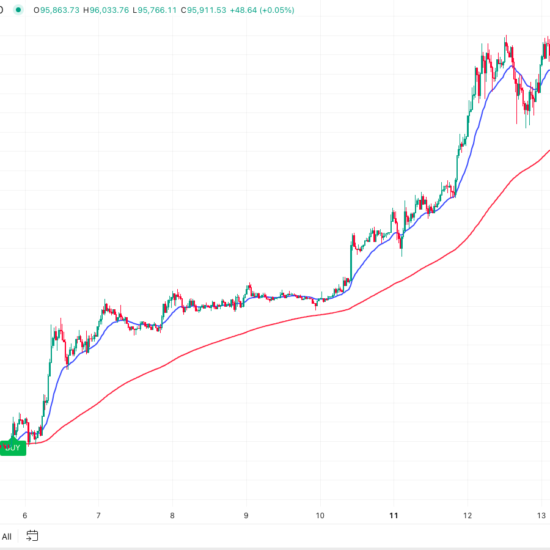
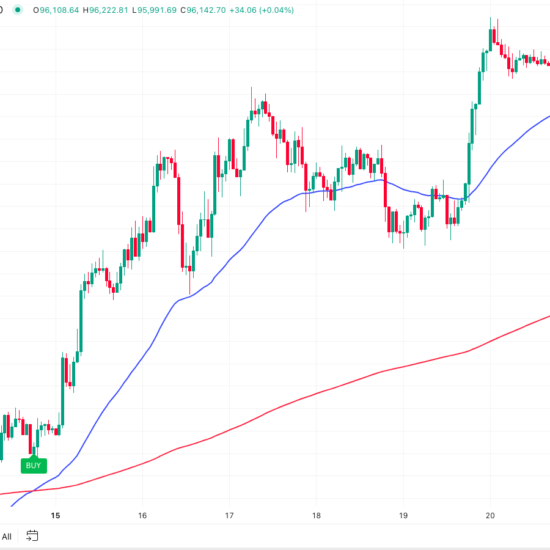
1. Moving Averages (MAs) – The Trend Detectives 🔍
- What They Do: Moving Averages smooth out the noise in price data to help you spot trends more easily. They’re like your personal trendspotter, letting you know if a stock is in a bullish (up) or bearish (down) phase.
- How to Use Them: A popular strategy is the Golden Cross, where a shorter moving average (like the 50-day MA) crosses above a longer moving average (like the 200-day MA). This signals a potential buy, as the market is showing bullish momentum. 🚀
2. RSI (Relative Strength Index) – The Overbought/ Oversold Detective 🕵️♂️
- What It Does: RSI measures how overbought or oversold a stock is. It helps you spot when a stock is likely to reverse direction.
- How to Use It: RSI values above 70 indicate that a stock is overbought (and may be due for a pullback), while values below 30 suggest the stock is oversold and could rebound. Think of it like finding a sale on your favorite items 🛍️—time to buy when prices are low!
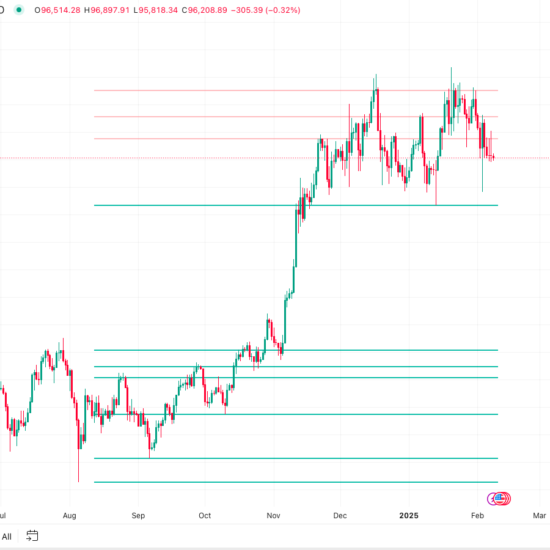
3. Bollinger Bands – The Volatility King 👑
- What It Does: Bollinger Bands measure price volatility and tell you when a stock is overbought or oversold. They’re like your market weather forecast—knowing when things are about to get stormy (or calm) 🌦️.
- How to Use Them: When the price touches the upper band, the stock is often overbought, and when it touches the lower band, it’s often oversold. These bands expand and contract depending on market volatility, helping you manage risk and find breakout opportunities.
4. MACD (Moving Average Convergence Divergence) – The Momentum Master 💪
- What It Does: MACD is a momentum indicator that shows you the relationship between two moving averages. It’s perfect for catching new trends early!
- How to Use It: When the MACD line crosses above the signal line, it’s a buy signal. When it crosses below, it’s a sell signal. It’s like the perfect dance partner—smooth, in sync, and always moving to the beat of the market. 💃
How to Build a Winning Strategy Using Indicators 🏆
Now that we’ve met the all-stars, how do you actually use them together in a trading strategy? 🤔 Let’s break it down:
Step 1: Confirm the Trend 📈
First, use indicators like Moving Averages or MACD to figure out the market direction. Are we in an uptrend? A downtrend? Or is the market just sideways, stuck in neutral? Once you know the trend, you can make informed decisions about whether to enter the market or sit it out.
Step 2: Look for Entry Signals 🎯
Next, use RSI or Stochastic Oscillator to find potential entry points. Is the market overbought or oversold? If the market is showing signs of exhaustion (overbought), you might want to wait for a pullback. If it’s oversold, it could be a great time to buy before the price bounces back.
Step 3: Manage Risk 🛡️
Use ATR or Bollinger Bands to set stop-loss levels. These indicators help you measure market volatility so you can determine the safest distance for your stops. Protecting your capital is key to long-term success!
Step 4: Exit Like a Pro 🚪
Finally, know when to take profits. MACD can help you spot when momentum is slowing down, signaling it’s time to exit. And, of course, don’t forget to trail your stops to lock in profits as the market moves in your favor.
Common Mistakes to Avoid 🚫
While Trading indicators are super helpful, they aren’t foolproof. Here are some common mistakes to avoid:
- Using Too Many Indicators 🧐
Don’t overcomplicate things! Stick to a few key indicators that complement each other and give you a clear signal. Too many indicators = confusion. 🌀 - Ignoring the Bigger Picture 👀
Indicators are great, but they don’t work in isolation. Always consider the bigger market context, such as news, earnings reports, or economic events that could impact the market. - Relying on Indicators Alone ❌
No indicator is perfect. Always combine them with good risk management and common sense!
- based on market conditions and new insights you gather.
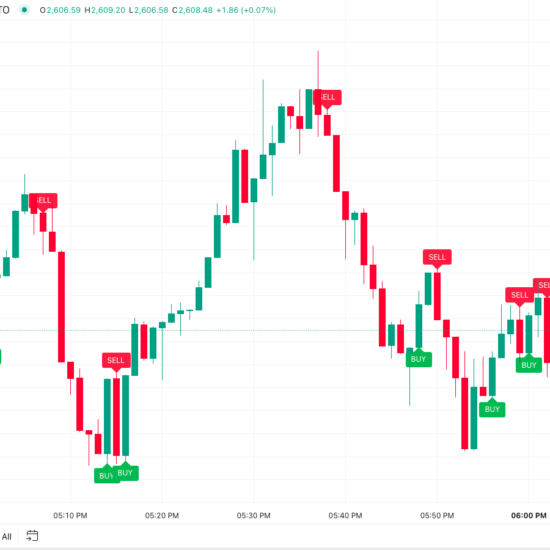
Did You Know About the Profit Hunter Indicator?
If you want to trade with clarity instead of second-guessing every move, the Profit Hunter Indicator is here to guide you. With up to 75% accuracy on buy and sell signals, it’s like a market compass pointing you in the right direction. 🧭📈 Why guess when you can trade smart? 🚀
Disclaimer: While the Profit Hunter Indicator provides reliable insights, no tool is perfect. Markets have their ups and downs, so always trade wisely and manage your risks. Even expert hunters know when to pause! 😉
Conclusion: Indicators Are Your Best Friend in the Market 🤝
So there you have it! Trading indicators are like your trading buddies that help you spot trends, time your moves, manage risk, and keep your emotions in check. With the right mix of indicators and a solid strategy, you’ll be navigating the market like a seasoned pro. 💪
Remember, trading isn’t about predicting the future perfectly; it’s about managing risk and making smart decisions. So, grab your indicators, put your plan into action, and let’s go make some profits! 💰
Happy trading, and don’t forget to smile while you do it! 😁